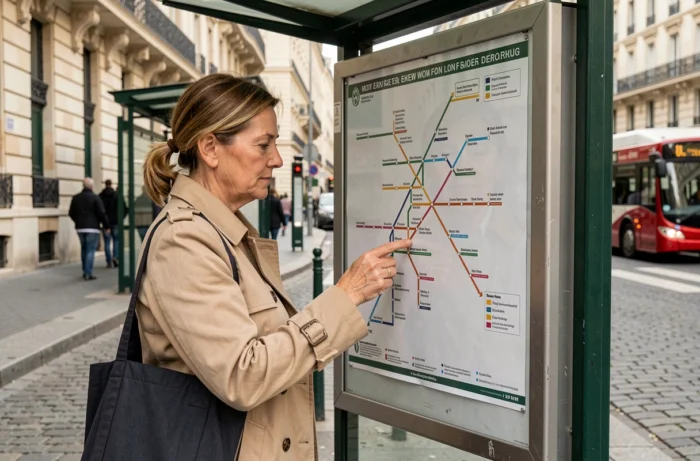
The Paris bus network, restructured as part of the Grand Paris des Bus, remains underutilized by the majority of users who limit themselves to the metro. Reading a dense line map, with its overlapping routes and variations, even discourages regular users. Having a simplified map that isolates the main axes and their transfer points radically changes the planning of a surface journey.
GTFS Data and Limitations of the Static Map for Parisian Buses
The PDF maps distributed at stops or downloadable from institutional websites freeze the network at a given moment. Any detour, temporary stop removal, or terminal modification renders them obsolete without notice.
The open data portal of Île-de-France Mobilités publishes the routes of the lines in GTFS format. This standard, used by most transport applications, describes each route, each stop, and each schedule in a set of files that can be utilized by any mapping tool. The GTFS data reflects actual routes, including temporary changes, which far exceeds the accuracy of a printed map.
For a regular user, cross-referencing a simplified map of buses in Paris with real-time verification in an app remains the most reliable combination. The map provides the overall view, while the app confirms that the journey is operational at the time of departure.
We recommend never planning a tight connection based solely on a static map, especially during exceptional events. The district town halls regularly publish disruption notices (detours during official visits, demonstrations, roadworks) that alter routes without the general map being updated.

Bus-Metro-RER-Tramway Connections: Identifying Real Exchange Nodes
Not all transfer stops are equal. An effective exchange node combines physical proximity of platforms and high frequency on both connected modes. A bus stop located three minutes’ walk from a metro entrance, with a bus every twelve minutes during off-peak hours, does not offer the same fluidity as a hub where buses and the metro share the same building.
On a simplified map, connections are often represented by a single pictogram, without distinction of quality. Three criteria allow for evaluating the reliability of a connection:
- The actual distance between the bus stop and access to the connected mode (metro, RER, or tramway). A “connection” pictogram may hide several hundred meters of walking, especially at major train stations.
- The combined frequency of the two lines. A connection between a bus running every half hour and an RER every fifteen minutes generates unpredictable cumulative waiting time.
- The accessibility of the path. The Parisian bus is the only surface mode accessible to all persons with reduced mobility, but transferring to a metro station without an elevator negates this advantage.
We observe that the most efficient hubs are located where trams and buses intersect at surface level, without a change in elevation. Bus-tram connections are generally underestimated on maps, even though they offer a quick and accessible transfer.
Opening Up to Competition: What Changes for Passenger Information
The operation of the Paris bus network is evolving with the expected arrival of new operators alongside RATP, overseen by Île-de-France Mobilités. Bus fares and colors must remain the same regardless of the operator, but the passenger information chain will be more centralized by the organizing authority.
For the user consulting a simplified map, this transition has a direct consequence: information sources are shifting. Line maps, detour notices, and schedules will increasingly be disseminated by Île-de-France Mobilités rather than by the historical operator. Checking the issuer of a mapping document becomes a useful reflex to ensure its currency.
Reliability of Maps During the Transition Period
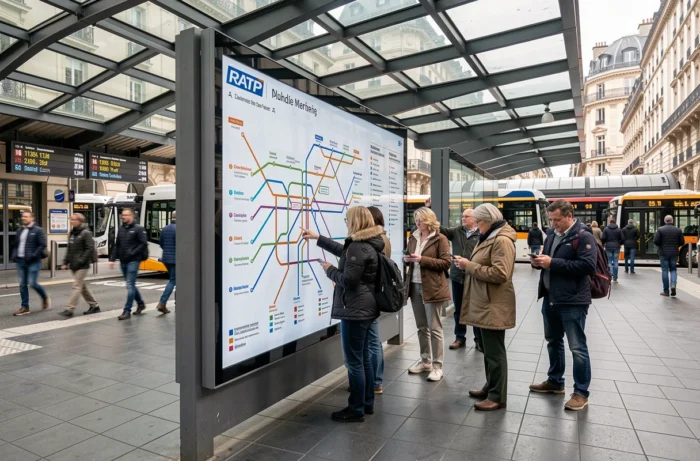
During the transition phase, several versions of the same map may coexist. A map published by RATP and a map published by Île-de-France Mobilités may not necessarily show the same routes if a line has been modified between two editions. Systematically favoring the map with the most recent update date avoids unpleasant surprises.
Building a Bus Journey in Paris Without an App
Not all situations allow for consulting a mobile app. Dead battery, lack of network in certain areas, or simply a preference for paper support: the simplified map regains its full utility.
The method consists of first identifying the starting point and the destination on the map, then identifying the lines that pass near each. If no direct line connects the two, one looks for a common stop for two lines, ideally an exchange node identified by a connection pictogram.
- Identify high-frequency lines (often represented by a thicker line on simplified maps) to minimize waiting time.
- Check if the route crosses an area likely to experience frequent disruptions (near train stations, demonstration routes).
- Note the line number and the name of the terminus in the desired direction, the only information consistently displayed at physical stops.
This approach remains slower than an automatic route calculation, but it develops a spatial knowledge of the network that the app does not provide. Knowing how to read a bus map makes one autonomous in the face of digital failures.
The Paris bus network serves areas that the metro does not cover, with total accessibility at surface level. A well-read simplified map, cross-referenced with an up-to-date information source, remains the most robust tool for navigating this network on a daily basis.